Four diagrams that define our system design language
There are four types of diagrams that we rely on to tell the story of a system design.
There are four types of diagrams that we rely on to tell the story of a system design.
Component Diagrams
Sequence Diagrams
Call Graph Diagrams
Ad-hoc Illustrations
Component diagrams
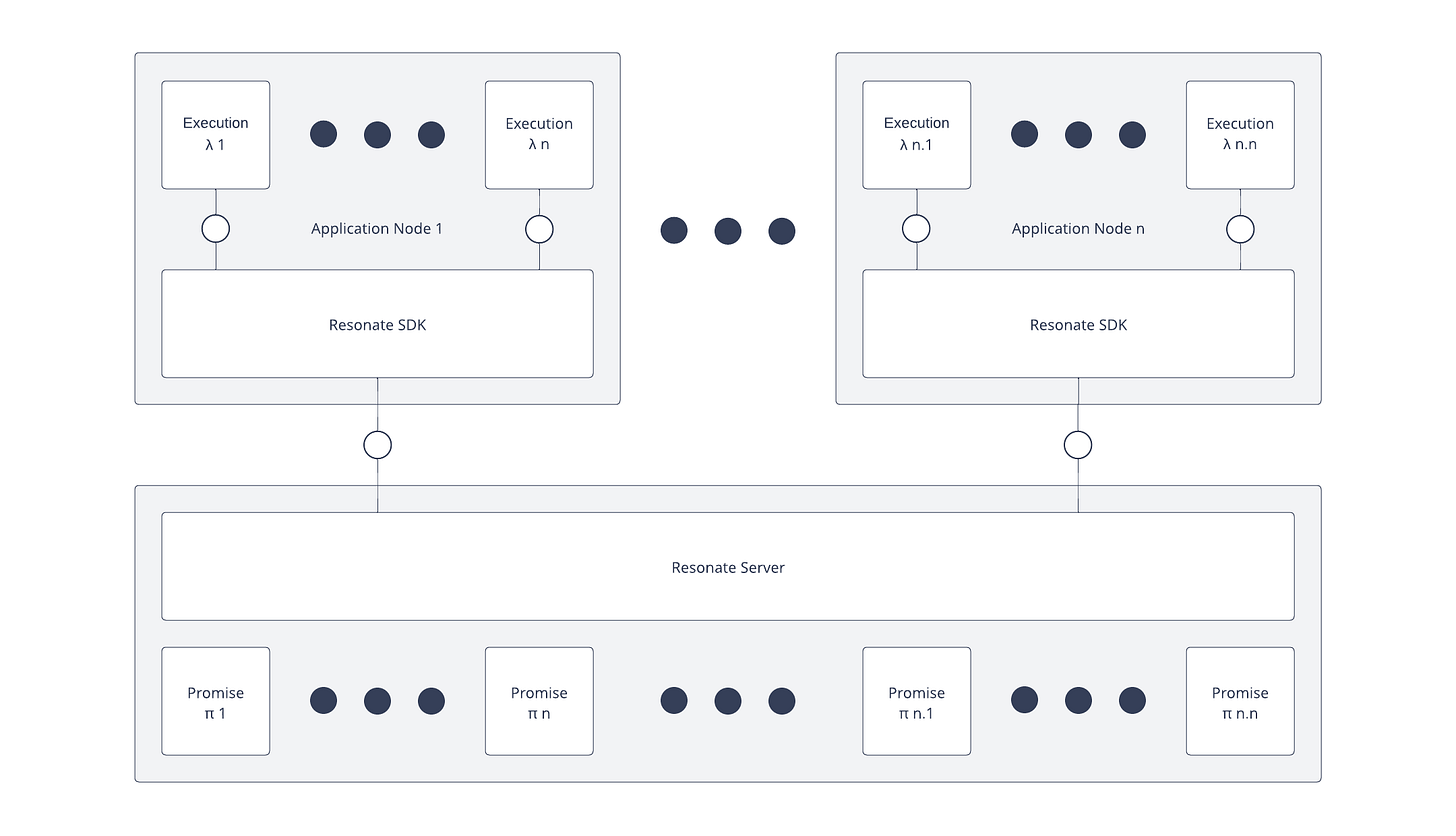
Component diagrams show the relationship between components.
Here is a standard FMC Resonate System Architectural Component Diagram showing the relationship of Resonate components:
A line with a circle in the middle, connecting a component with another another component, denotes a communication channel.
The three dark dots indicate replication.
The grey boxes surrounding the components encapsulate the physical components and a representation of the type of state they hold.
Sequence diagrams
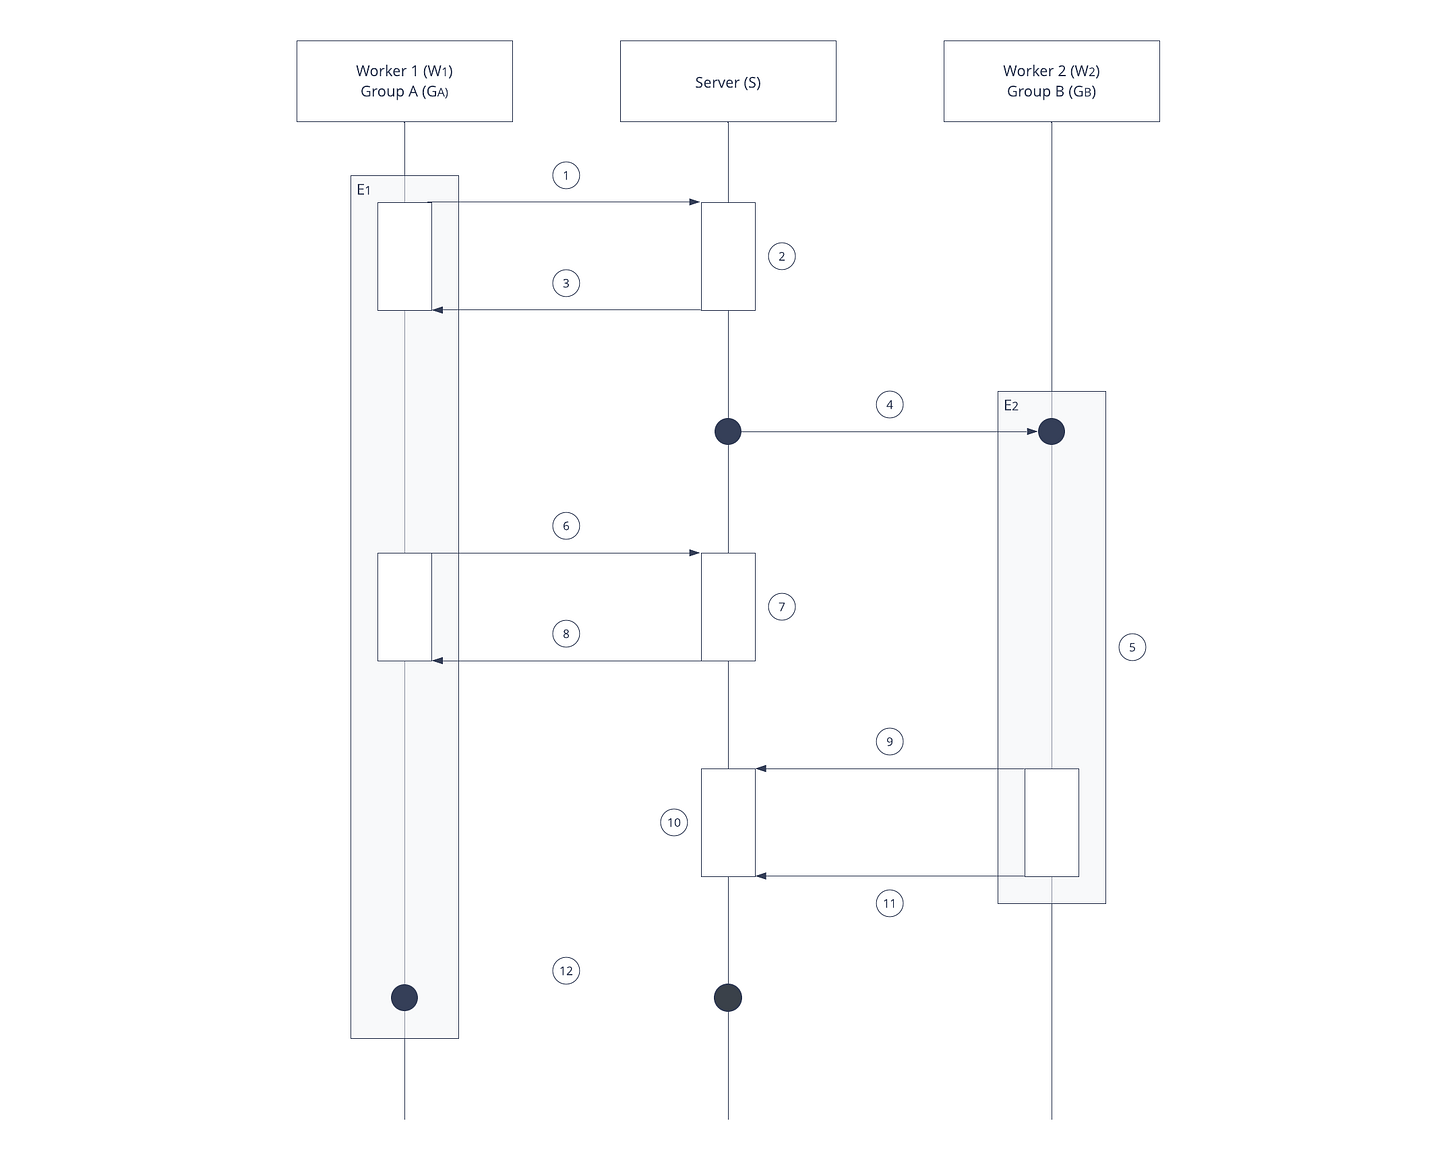
A sequence diagram shows how a particular situation unfolds between components.
Here is a standard Distributed Async Await Coordination Protocol Sequence Diagram showing how Eventual Resumption unfolds.
The sequence diagram is sometimes referred to as a “swim lane diagram”, where each component has a vertical lane representing its existence. Interactions between the components are represented by lines traversing the lanes in the sequence they would occur in the situation starting at the top.
Rather than adding explanation labels directly to the diagram, numbers have been added to each step in the sequence. This way the diagram can pair with an ordered list that explains each step in the sequence:
When the calling execution E₁, identified by Durable Promise P₁ and hosted on worker W₁, invokes a function remotely, W₁ sends a request to create a Durable Promise (P₂) to the server S.
Upon receiving the request, the server S creates the durable promise P₂.
The Server S sends a response to W₁ which forwards P₂ to E₁.
The server S sends an Invoke(P₂) message to process group GB, here delivered to worker W₂
Worker W₂ spawns execution E₂
When the calling execution E₁ awaits promise P₂, W₁ sends a request to register a callback Resume(P₁, P₂) deliverable to GA with preference W₁ on P₂ to server S
Upon receiving the request, since P₂ is still pending, server S registers the callback C₁ with promise P₂.
Server S sends a response indicating success to worker W₁, which suspends E₁
When the called execution E₂ returns, the worker W₂ sends a request to resolve or reject durable promise P₂ to the server S
Upon receiving the request, the server S resolves or rejects the durable promise P₂.
Server S sends a response containing P₂ to W₂.
The server S sends a Resume(P₁, P₂) message to process group GA with the preference of W₁, here delivered to worker W₁, which suspends E₁.
Call Graphs
A Call Graph is a custom diagram created to explain aspects of the Distributed Async Await specification. It can be paired with code examples to show the map of the Distributed Async Await durable world.
Here is an example of a custom Chain Request Flow Call Graph Diagram across three services.
This Call Graph could pair with a code example like this:
// service a
func foo() {
    // ...
    await bar()
    // ...
    return
}
// service b
func bar() {
// ...
await baz()
// ...
return
}// service c
func baz() {
// ...
return
}This example could be contrasted to this Fan Out Request Flow Call Graph Diagram showing how the call graph changes when request flow does.
Request flow:
// service a
func foo() {
    // ...
    await bar()
    await baz()
    // ...
    return
}
// service b
func bar() {
// ...
return
}// service c
func baz() {
// ...
return
}While Call Graph Diagrams are custom to the Distributed Async Await world, they adhere to a set of rules which set them apart from Ad-hoc Illustrations.
Ad-hoc Illustrations
When possible, standard component, standard sequence, and custom Call Graph diagrams are preferred. However, there are often times when an Ad-hoc illustrations helps to convey a concept that isn’t explainable with the diagrams.
Here is an example Ad-hoc Illustration that conveys the life-cycle of a promise:
Here are two illustrations that compare short-running executions on long-running resources and long-running executions on short-running resources.
Short-running executions on long-running resources:
Long-running executions on short-running resources:
Conclusion
Ad-hoc diagrams are not constrained by rules like the diagrams are, allowing for flexibility in conveying ideas.
However, because there are rules that govern the diagrams, there is a baseline of consistency that one can expect while reviewing them. This consistency helps keep mental models intact and enable’s people to communicate clearly about the ideas expressed in the diagrams.


